Covid-19 charts generator
Repo: github.com/w3slley/covid19-portugal-wikipedia
Technologies used: Python, pdfminer, pandas, matplotlib
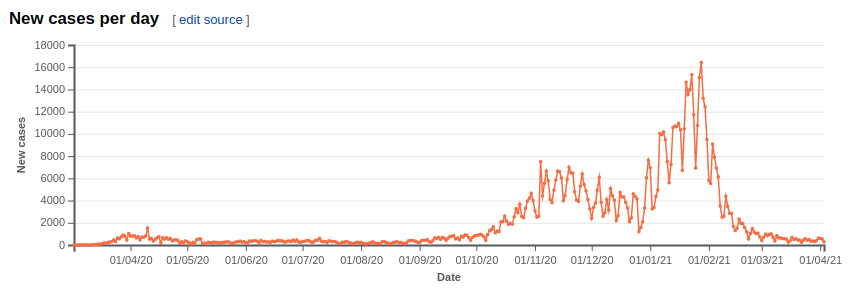
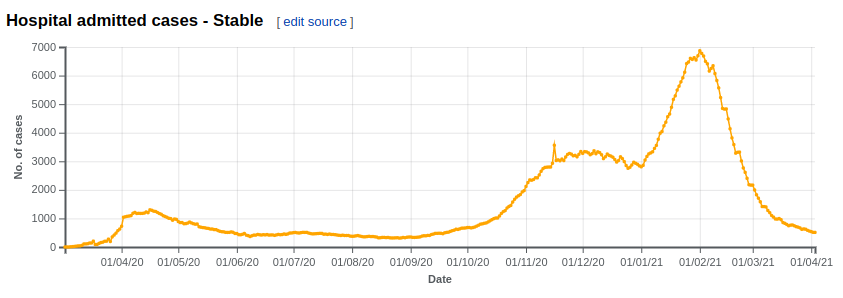
This project has the goal of automating the process of updating data charts on the Portugal’s Covid-19 pandemic Wikipedia page. In uncertain times like these, the internet often becomes a “jungle” of misinformation. Collaborating with other people to share accurate and updated information from trusted national health authorities is my attempt to help make the internet a better place.
The developed Python script parses the Direção Geral de Saúde’s website and gets from the PDF reports all the necessary information to produce/update charts and tables on the Portugal Covid-19 Wikipedia Page. Recently I also started using the DSSG Portugal/VOST REST API to update information that was removed from the daily reports (like the proportion of cases/deaths by age and gender, for instance).
To extract the data from the PDF file I used pdfminer. The data is then saved into a .csv file and later used for the creation of the charts and tables. These are now ready to be inserted into the edit section on the Wikipedia page. More information about the process of contributing to the Wikipedia page (both in english and in portuguese) can be obtained in the GitHub repository.
Example of charts


